Compute area under precision-recall curve
compute_pr_auc_from_curve.RdCompute the area under the precision-recall curve given pr curve data. This
function is mainly intended for generating plot data. For computation of the
area under the curve, use compute_pr_auc. The function uses a simple
trapezoidal rule approximation along the steps of the generated curve data.
compute_pr_auc_from_curve(
  pr_curve_data,
  grouping_vars = NULL,
  drop_empty_groups = options::opt("drop_empty_groups")
)
Arguments
- pr_curve_data
A data.frame as produced by
compute_pr_curve, containing columns"searchspace_id", "prec", "rec", "prec_cummax", "mode".- grouping_vars
Additional columns of the input data to group by.
- drop_empty_groups
Should empty levels of factor variables be dropped in grouped set retrieval computation? (Defaults to
TRUE, overwritable using option 'casimir.drop_empty_groups' or environment variable 'R_CASIMIR_DROP_EMPTY_GROUPS')
Value
A data.frame with a column "pr_auc" and optional
grouping_vars.
See also
compute_pr_curve
Examples
library(ggplot2)
library(casimir)
gold <- tibble::tribble(
~doc_id, ~label_id,
"A", "a",
"A", "b",
"A", "c",
"B", "a",
"B", "d",
"C", "a",
"C", "b",
"C", "d",
"C", "f"
)
pred <- tibble::tribble(
~doc_id, ~label_id, ~score, ~rank,
"A", "a", 0.9, 1,
"A", "d", 0.7, 2,
"A", "f", 0.3, 3,
"A", "c", 0.1, 4,
"B", "a", 0.8, 1,
"B", "e", 0.6, 2,
"B", "d", 0.1, 3,
"C", "f", 0.1, 3,
"C", "c", 0.2, 1,
"C", "e", 0.2, 1
)
pr_curve <- compute_pr_curve(
gold,
pred,
mode = "doc-avg",
optimize_cutoff = TRUE
)
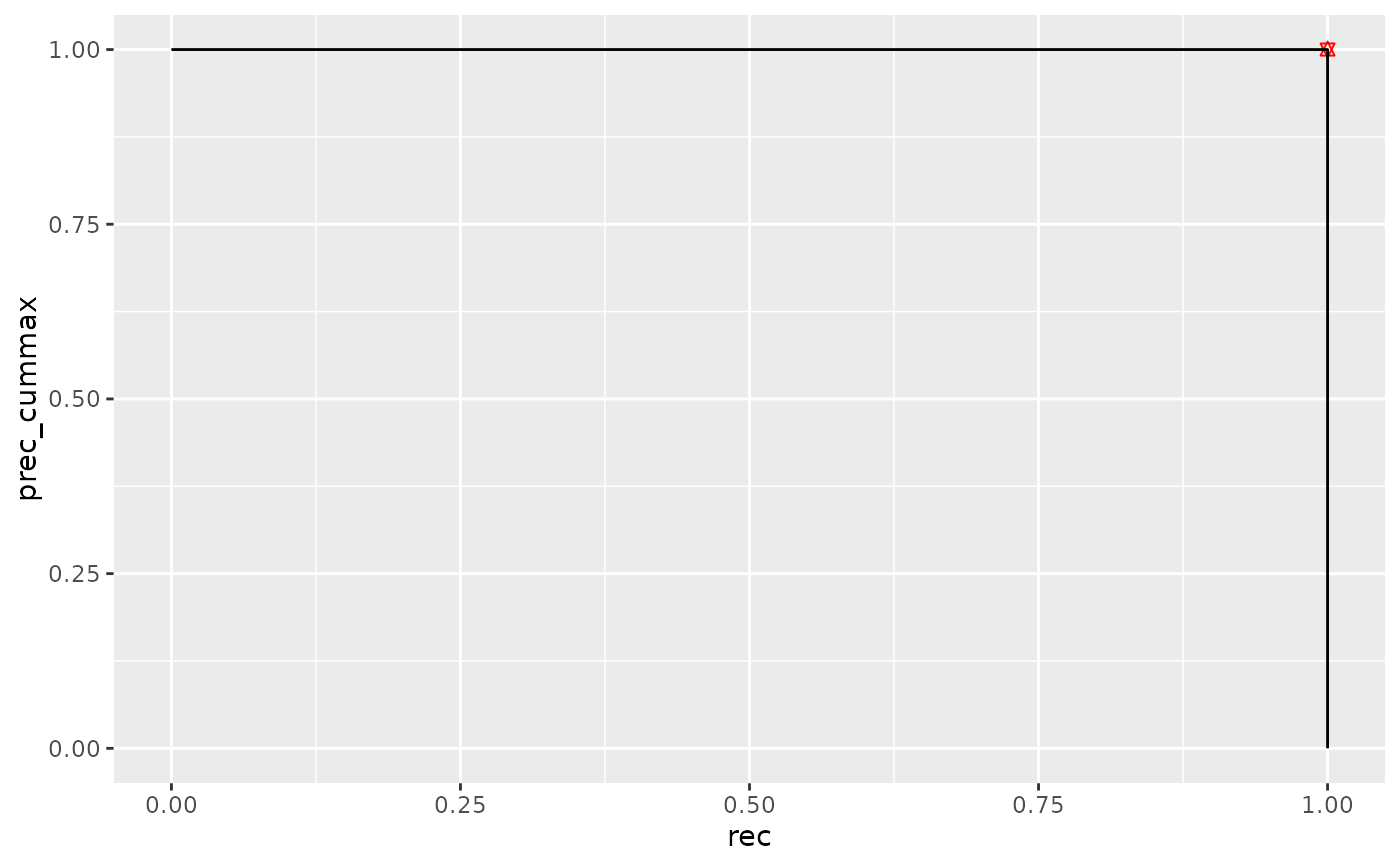
auc <- compute_pr_auc_from_curve(pr_curve)
# note that pr curves take the cummax(prec), not the precision
ggplot(pr_curve$plot_data, aes(x = rec, y = prec_cummax)) +
geom_point(
data = pr_curve$opt_cutoff,
aes(x = rec, y = prec_cummax),
color = "red",
shape = "star"
) +
geom_text(
data = pr_curve$opt_cutoff,
aes(
x = rec + 0.2, y = prec_cummax,
label = paste("f1_opt =", round(f1_max, 3))
),
color = "red"
) +
geom_path() +
coord_cartesian(xlim = c(0, 1), ylim = c(0, 1))