Compute precision-recall curve
compute_pr_curve.RdCompute the precision-recall curve for a given step size and limit range.
compute_pr_curve(
  predicted,
  gold_standard,
  doc_groups = NULL,
  label_groups = NULL,
  mode = "doc-avg",
  steps = 100,
  thresholds = NULL,
  limit_range = NA_real_,
  optimize_cutoff = FALSE,
  graded_relevance = FALSE,
  propensity_scored = FALSE,
  label_distribution = NULL,
  cost_fp_constant = NULL,
  replace_zero_division_with = options::opt("replace_zero_division_with"),
  drop_empty_groups = options::opt("drop_empty_groups"),
  ignore_inconsistencies = options::opt("ignore_inconsistencies"),
  verbose = options::opt("verbose"),
  progress = options::opt("progress")
)
Arguments
- predicted
Multi-label prediction results. Expects a data.frame with columns
"label_id", "doc_id", "score".- gold_standard
Expects a data.frame with columns
"label_id", "doc_id".- doc_groups
A two-column data.frame with a column
"doc_id"and a second column defining groups of documents to stratify results by. It is recommended that groups are of type factor so that levels are not implicitly dropped during bootstrap replications.- label_groups
A two-column data.frame with a column
"label_id"and a second column defining groups of labels to stratify results by. Results in each stratum will restrict gold standard and predictions to the specified label groups as if the vocabulary was consisting of the label group only. All modes"doc-avg", "subj-avg", "micro"are supported within label strata. Nevertheless, mixingmode = "doc-avg"with fine-grained label strata can result in many missing values on document-level results. Also rank-based thresholding (e.g. top 5) will result in inhomogeneous numbers of labels per document within the defined label strata.mode = "subj-avg"ormode = "micro"can be more appropriate in these circumstances.- mode
One of the following aggregation modes:
"doc-avg", "subj-avg", "micro".- steps
Number of breaks to divide the interval \([0, 1]\) into. These breaks will be used as quantiles to be calculated on the true positive suggestions' score distribution and therefore build one axis of the grid for computing the pr curve.
- thresholds
Alternatively to steps, one can manually set the thresholds to be used to build the pr curve. Defaults to the quantiles of the true positive suggestions' score distribution to be obtained from
steps.- limit_range
A vector of limit values to apply on the rank column. Defaults to NA, applying no cutoff on the predictions' label rank.
- optimize_cutoff
Logical. If
TRUE, a grid search in the search space specified bylimit_rangeandstepsorthresholdsis performed to find optimal limit and threshold with respect to F1 measure.- graded_relevance
A logical indicator for graded relevance. Defaults to
FALSEfor binary relevance. If set toTRUE, thepredicteddata.frame should contain a numeric column"relevance"with values in the range of \([0, 1]\).- propensity_scored
Logical, whether to use propensity scores as weights.
- label_distribution
Expects a data.frame with columns
"label_id", "label_freq", "n_docs".label_freqcorresponds to the number of occurences a label has in the gold standard.n_docscorresponds to the total number of documents in the gold standard.- cost_fp_constant
Constant cost assigned to false positives.
cost_fp_constantmust be a numeric value > 0 or one of 'max', 'min', 'mean' (computed with reference to thegold_standardlabel distribution). Defaults to NULL, i.e. label weights are applied to false positives in the same way as to false negatives and true positives.- replace_zero_division_with
In macro averaged results (doc-avg, subj-avg), it may occur that some instances have no predictions or no gold standard. In these cases, calculating precision and recall may lead to division by zero. CASIMiR standardly removes these missing values from macro averages, leading to a smaller support (count of instances that were averaged). Other implementations of macro averaged precision and recall default to 0 in these cases. This option allows to control the default. Set any value between 0 and 1. (Defaults to
NULL, overwritable using option 'casimir.replace_zero_division_with' or environment variable 'R_CASIMIR_REPLACE_ZERO_DIVISION_WITH')- drop_empty_groups
Should empty levels of factor variables be dropped in grouped set retrieval computation? (Defaults to
TRUE, overwritable using option 'casimir.drop_empty_groups' or environment variable 'R_CASIMIR_DROP_EMPTY_GROUPS')- ignore_inconsistencies
Warnings about data inconsistencies will be silenced. (Defaults to
FALSE, overwritable using option 'casimir.ignore_inconsistencies' or environment variable 'R_CASIMIR_IGNORE_INCONSISTENCIES')- verbose
Verbose reporting of computation steps for debugging. (Defaults to
FALSE, overwritable using option 'casimir.verbose' or environment variable 'R_CASIMIR_VERBOSE')- progress
Display progress bars for iterated computations (like bootstrap CI or pr curves). (Defaults to
FALSE, overwritable using option 'casimir.progress' or environment variable 'R_CASIMIR_PROGRESS')
Value
A list of three elements:
plot_dataA data.frame with full pr curves and columns"searchspace_id", "prec", "rec", "prec_cummax", "mode".opt_cutoffA data.frame with optimal cutoffs and columns"thresholds", "limits", "searchspace_id", "f1_max", "prec", "rec", "prec_cummax", "mode".all_cutoffsA data.frame with all cutoffs and columns"thresholds", "limits", "searchspace_id", "metric", "value", "support", "f1_max", "prec", "rec", "prec_cummax", "mode".
All three data.frames may contain additional stratification variables
passed with doc_groups and label_groups. The latter two
data.frames are non-empty only if optimize_cutoff == TRUE.
Examples
library(ggplot2)
library(casimir)
gold <- tibble::tribble(
~doc_id, ~label_id,
"A", "a",
"A", "b",
"A", "c",
"B", "a",
"B", "d",
"C", "a",
"C", "b",
"C", "d",
"C", "f"
)
pred <- tibble::tribble(
~doc_id, ~label_id, ~score, ~rank,
"A", "a", 0.9, 1,
"A", "d", 0.7, 2,
"A", "f", 0.3, 3,
"A", "c", 0.1, 4,
"B", "a", 0.8, 1,
"B", "e", 0.6, 2,
"B", "d", 0.1, 3,
"C", "f", 0.1, 1,
"C", "c", 0.2, 2,
"C", "e", 0.2, 2
)
pr_curve <- compute_pr_curve(
pred,
gold,
mode = "doc-avg",
optimize_cutoff = TRUE
)
auc <- compute_pr_auc_from_curve(pr_curve$plot_data)
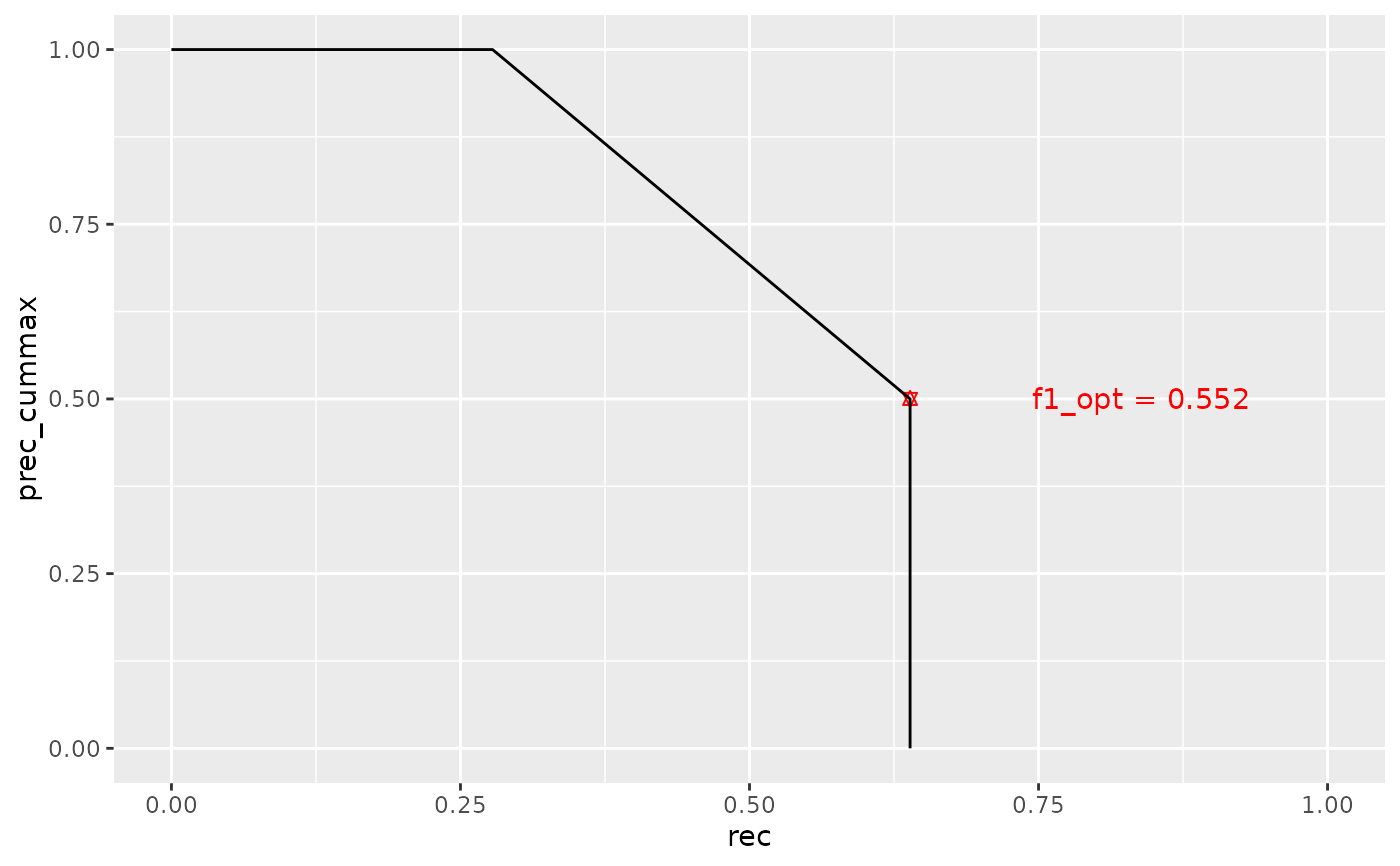
# note that pr curves take the cummax(prec), not the precision
ggplot(pr_curve$plot_data, aes(x = rec, y = prec_cummax)) +
geom_point(
data = pr_curve$opt_cutoff,
aes(x = rec, y = prec_cummax),
color = "red",
shape = "star"
) +
geom_text(
data = pr_curve$opt_cutoff,
aes(
x = rec + 0.2, y = prec_cummax,
label = paste("f1_opt =", round(f1_max, 3))
),
color = "red"
) +
geom_path() +
coord_cartesian(xlim = c(0, 1), ylim = c(0, 1))